
Welcome to the Vibrology App Data Mine.
This is where you can query and analyze the data snapshots that have been collected with the Vibrology App.
Logged snapshots are stored for 3 days unless the snapshot has either a Type or AutoType value > 0. In this case the prior snapshot plus the two subsequent snapshots are saved. The value of Type is determined by which Pin Button was pressed by the user when at the time of snapshot.

If you just simply click the Search button you will get the first 500 snapshots that your device has logged.
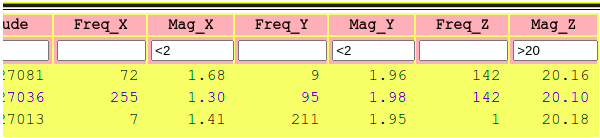
Drill down and refine the results by defining search terms in the fields provided in Summary Table Header.
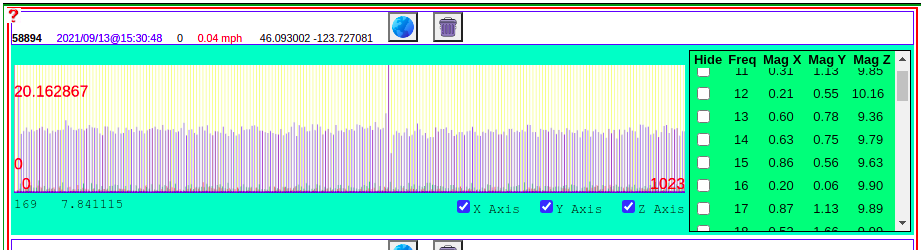
Snapshot Summaries are displayed in the Summary Table. Each entry can be viewed further in the Snapshot Pallet by double clicking the entry.
Logged snapshots are stored for 3 days unless the snapshot has either a Type or AutoType value > 0. In this case the prior snapshot plus the two subsequent snapshots are saved. The value of Type is determined by which Pin Button was pressed by the user when at the time of snapshot.
The Search Button
The Data Mine Key
| Enter Your Unique Key | The Pothole Project |